UX, Data & Research
Designing a tactile visualization system.
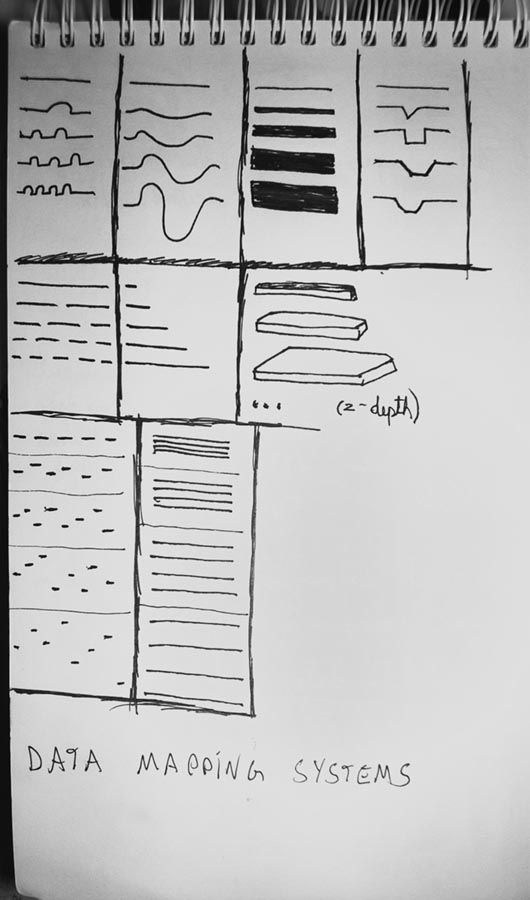
Starting from Jaques Bertin’s idea of visual variables, this research proposes a system of tactile variables that can be mapped to data. Supervised by prof. Isabel Meirelles (author of the book Design for Information) Its main goal is to develop a way for visually impaired populations to read data. Visual representation of data has an extensive literature corpus and applications, whereas alternate modes of representation are way behind in terms of research projects and relevance.
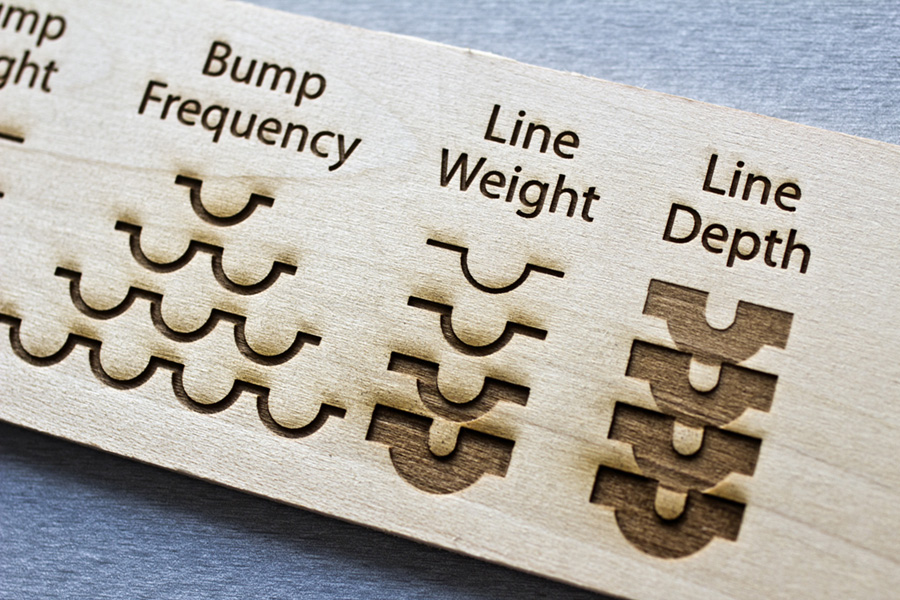
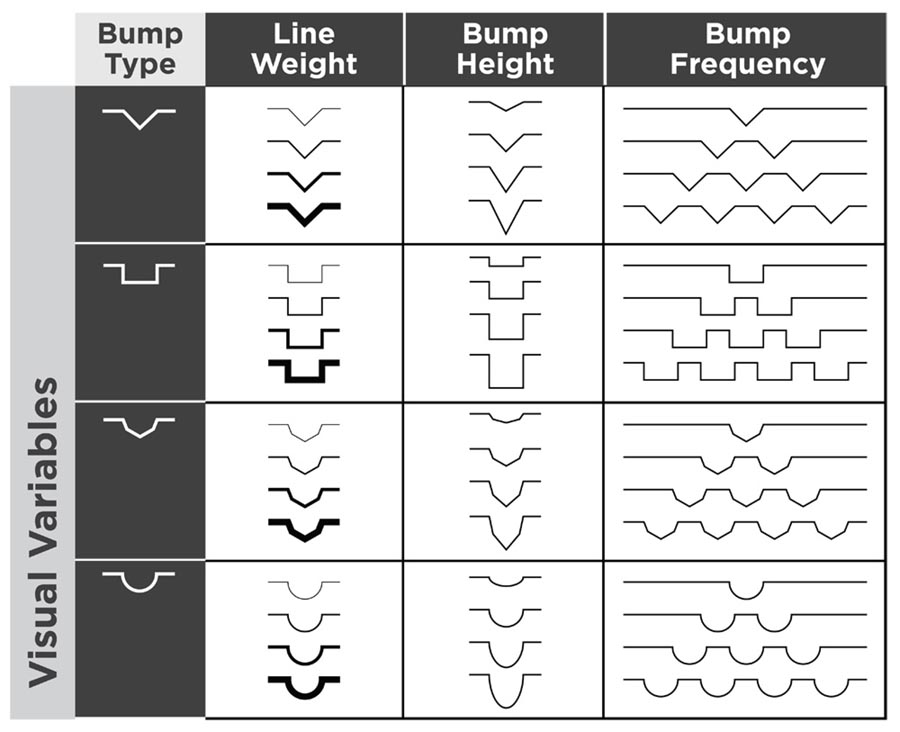
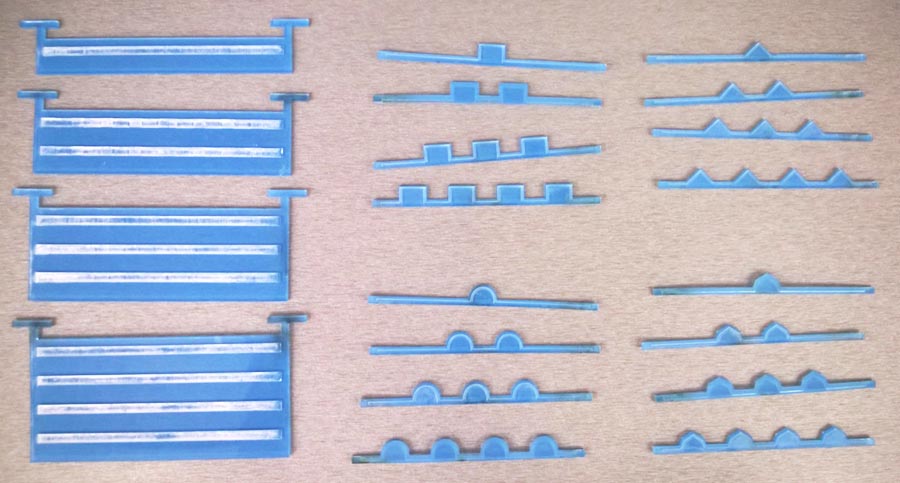
Research started with possible tactile variables such as heat level of a surface and eventually evolved to a more abstract approach. Bumps added to a line. The bump type represents the data category and bump weight, height and frequency its variables.
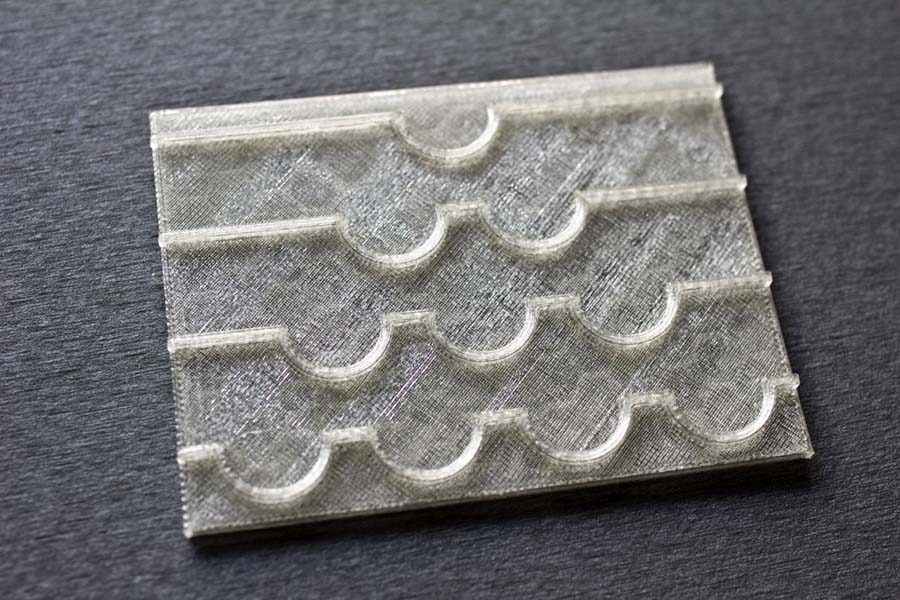
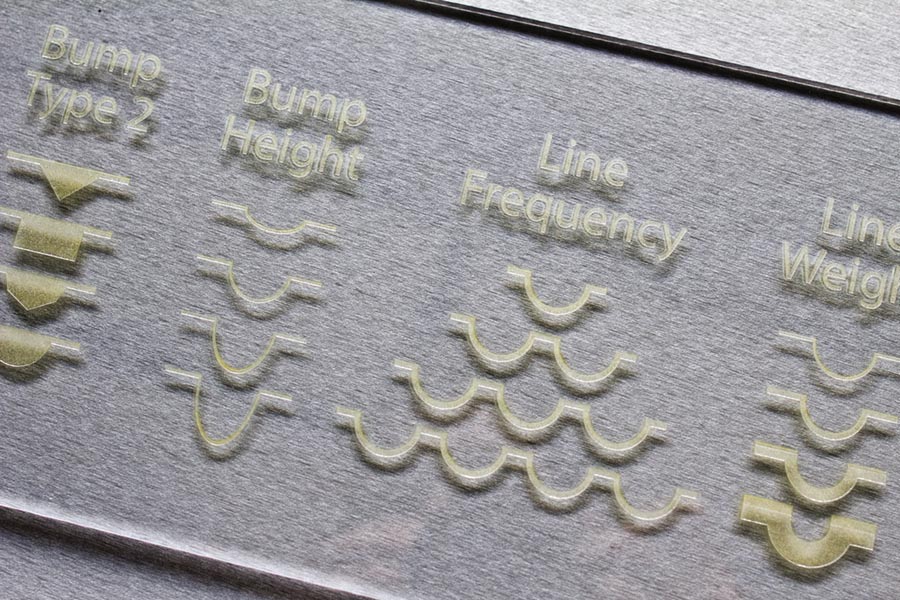
The three images shown above are the material and process tests - laser engraving on wood and acrlyic and 3d printing were tested. Each process resulted in a very different perceptual result and, ultimately, 3d printing showed to be better suited for the project.
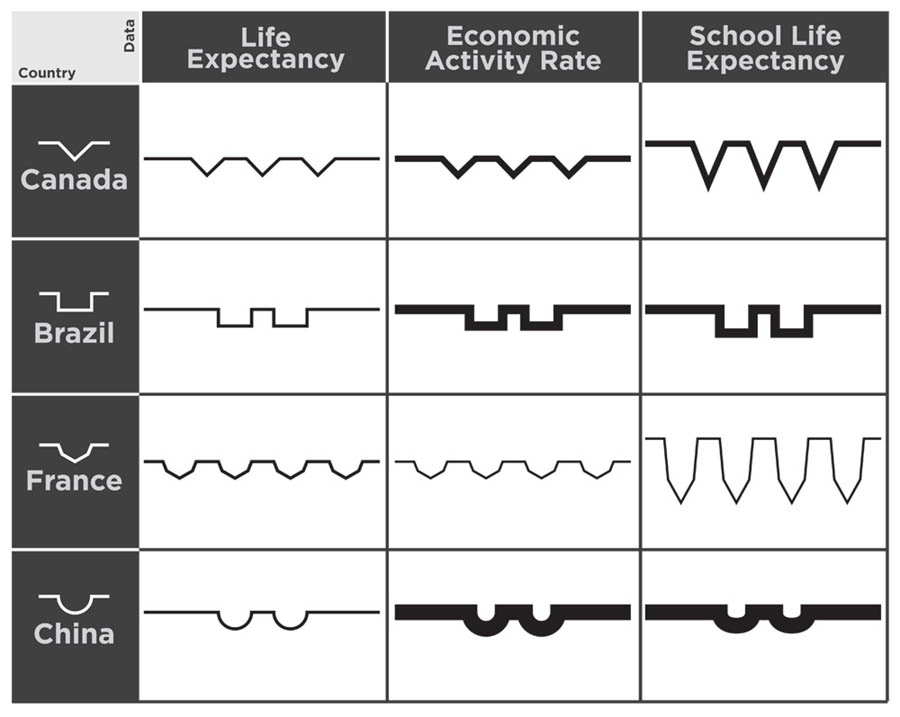
The three images bellow show a process image, a matrix with the variables system and an example data set. As can be seen in the images, the system, in its current form, doesn’t allow a very large resolution.
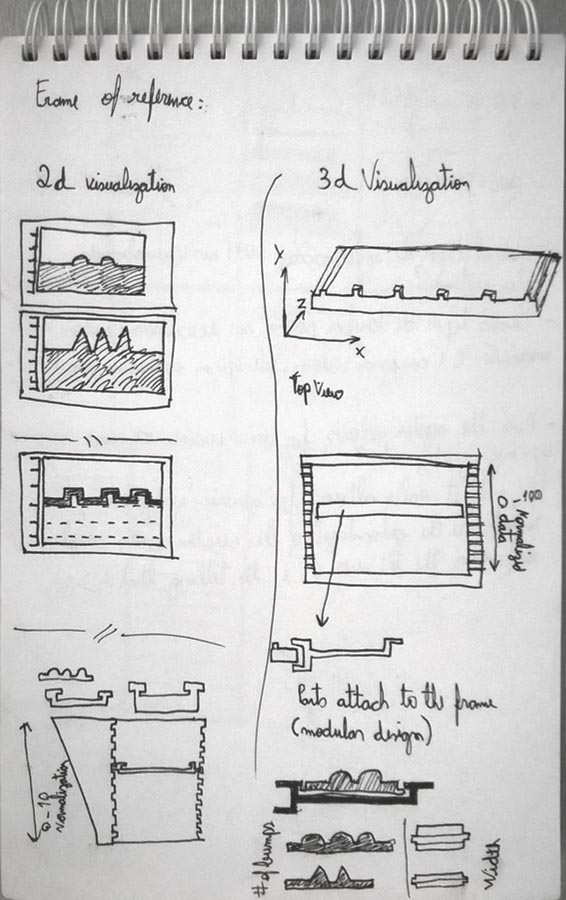
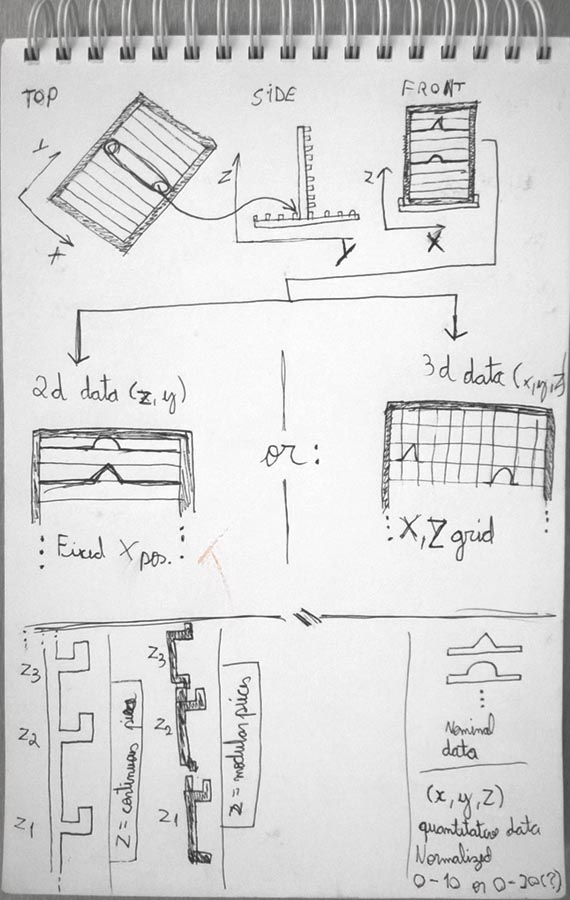
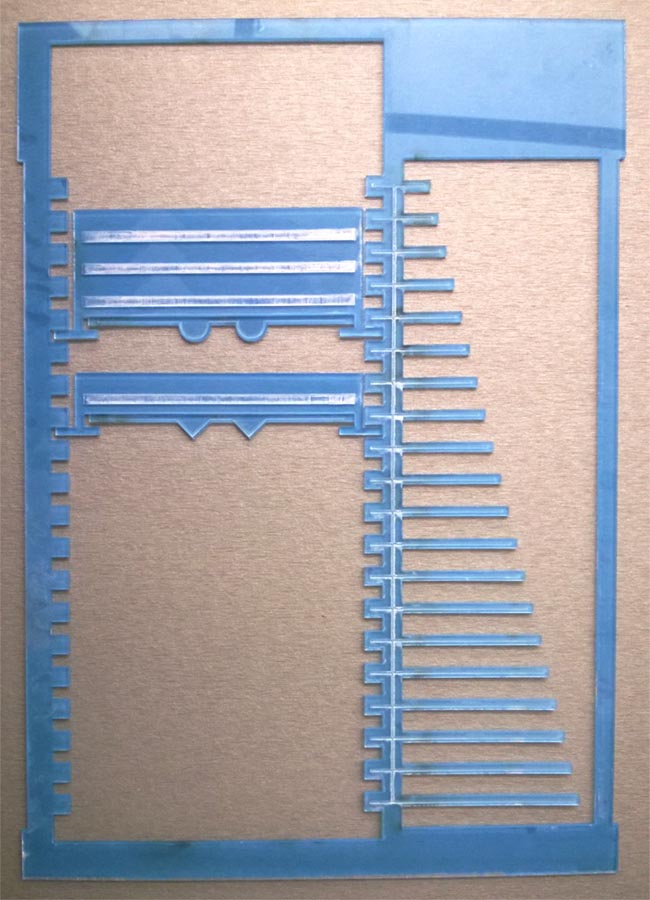
The images bellow show a proposed design using the tactile variables system. Using a modular approach, the laser-cut objects can be placed on a frame. This design soon took a slight different path and the variables, althought the same, had to be approach in a different way.
In the end, user test with the intended target population is still needed to evaluate how effective the variable system is and if the proposed design work as an application of the system.
Read the paper